How to Integrate a Health Check Endpoint into Your App
As your client base grows, so does your responsibility to provide a reliable service at all times. Let's look at how you may achieve peace of mind by adding a few lines of code.
What is the purpose of a health check endpoint?
To begin with, making one is straightforward and does not need a great deal of technical knowledge. Google "How to create a [insert language] health check", and you'll get some code you can copy/paste in no time!
The following are some possible causes:
- SLA — You may be forced to adhere to a Service Level Agreement (SLA) that outlines the amount of uptime you must commit to.
- Money loss — a minute of downtime may cost tens of thousands of dollars in some businesses. What would you lose in terms of money and business if you had a minute, an hour, or an entire day of downtime?
- Reputation — a history of downtimes tarnishes your company's image.
We'll explore how to use Node.js with the most popular framework ( Express ) to build a health route that can be checked using an website monitoring service and ensure that your application never goes down without warning.
const app = express()
const router = express.Router()
router.use((req, res, next) => {
res.header("Access-Control-Allow-Methods", "GET")
next()
})
router.get("/health", (req, res) => {
res.status(200).send("Ok")
})
app.use("/api/v1", router)
const server = http.createServer(app)
server.listen(3000)
This responds with a 200 status code and an Ok message in the body.
Now we are going to add some additional code that allows us to get more information:
const process = require("process")
router.get("/health", (req, res) => {
const data = {
uptime: process.uptime(),
message: "Ok",
date: new Date(),
}
res.status(200).send(data)
})
The process.uptime() method returns the number of seconds the current Node.js process has been running, and the return value includes fractions of a second. Use Math.floor() to get whole seconds. More information here.
Other connection tests, such as the database or Redis, might also be included. You should also perform a health check for each micro-service you're using!
Automate the checks
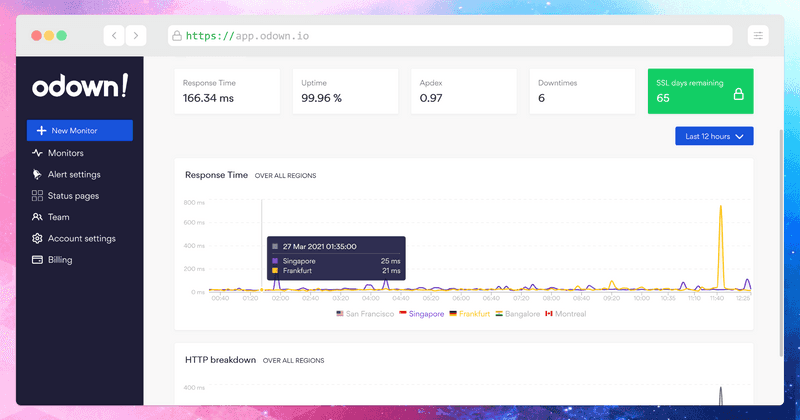
Now that we have a fresh new endpoint to check our app's health, let's monitor its uptime and other data like response time and ensure we're alerted when the fan goes off. You may use a dedicated service like Odown to track the availability of websites and APIs in real-time. Build an account, and you'll be redirected to a page where you may create your first monitor.
The new endpoint's availability is continually checked by simply adding it to Odown's app without any extra configuration. Its uptime and response time are displayed for the given date period across several regions (California, Singapore, Sydney, Frankfurt, and more), and historical data is displayed after a few minutes.
Furthermore, it interacts effortlessly with alerting technologies like Slack, Webhook, Telegram, Discord or sending SMS to you and your teams!
Conclusion
This was a fundamental and uncomplicated method of performing a health check! This will provide you with additional peace of mind and will only encourage you to improve your app's functionality.
I hope you found this helpful; please tweet @me if you set up anything else, and please share your code snippets in other languages like Go, Python, or Laravel!


